


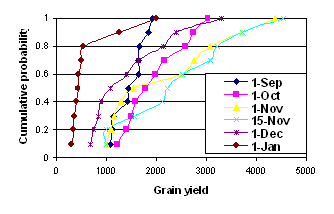
The simulated dates of anthesis and physiological maturity revealed that late-sown (Dec and Jan) crops flowered and filled grain during periods of high temperature (not shown), resulting in small yields. Grain yields ranged from 0.4 to 4.6 t/ha, and were greatest for 15 Nov and smallest for 1 Jan sowings (Fig. 1). Yields for 1 Nov sowings varied from 1.0 to 4.6 t/ha, and were less than 2.5 t/ha in 50% of years, and greater than 3.0 t/ha in 20% of years. November-sown crops had the best chance of low temperature during flowering and low water stress during grain filling, contributing to greater yields than the later-sown crops. With September sowings, rainfall during the vegetative growth period varied from 200 to 550 mm. With sowings later than September, rainfall seldom exceeded 100 mm and in 50% of years was less than 40 mm.
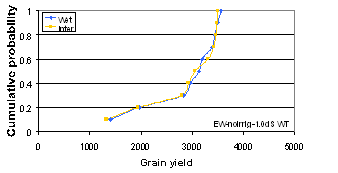
 With an initial WTD of 0.5 m and salinity of 1 dS/m, yields of early-sown wheat without irrigation ranged from 1-3.5 t/ha and exceeded 2.9 t/ha in 70% of years, with little difference between the wet and intermediate initial SWCs (Fig. 2). With WTD 0.5 m yield declined when the salinity of the watertable was increased to 20 dS/m (range 0.8-2.4 t/ha). However, for starting WTD of 1m or deeper, yield was not greatly affected by watertable salinity. Yields of late-sown non-irrigated wheat were smaller than of early-sown wheat for all starting conditions. For example, with a 0.5 m, 1 dS/m watertable at sowing, yields of late-sown wheat were always less than 2 t/ha. With frequent irrigation, yields ranged from 5-6 t/ha, regardless of sowing dates and initial SWCs, WTD and salinity. For non-irrigated wheat, WTD at harvest was almost always lower than at sowing - i.e. there was net discharge of groundwater, regardless of starting conditions and sowing date. With frequent irrigation, watertables were always higher at the end of the season compared with the non-irrigated situation, and they often rose over the season (net recharge), more so for deeper starting WTD (not shown).
Fig. 1. Cumulative probability distributions for Fig. 2: Cumulative probability distributions for simulated yields (kg/ha) of wheat for various simulated yields (kg/ha), with initial watertable sowing dates at Nashipur, Bangladesh. depth 0.5 m and salinity 1 dS/m and no irrigation, at Griffith, Australia.
