Remote sensing is a valuable source of data in rice-based agriculture, especially when regional-scale issues are the concern. However, there are some limitations of remote sensing regarding agricultural applications including:
1. Data availability;
2. Length of recording period;
3. Limited mapping capability;
4. Requirement of expertise and computer facilities; and
5. Cost
A very brief discussion of these topics follows.
Non-availability of remotely sensed data may be due, among other things, to rocket launch, satellite operational problems or political issues. Events such as these will continue to occur and operational systems must pre-determine the influence of any data stream becoming non-available. Satellites have different repeat cycles (Table 1). This means that certain satellites will provide only 2 images per month, for example, whereas others can produce an image every
day. This can have considerable impact on agricultural applications since repeat cycle
characteristics of satellites are one of the determinants for forecasting yield with the ∫NDVI approach, for example. Also, these high repeat cycle platforms usually have lower spatial
resolution, impacting the appropriateness of its data to fine-scale applications. Another major cause of optical data unavailability is cloud coverage. This could be problematic when timing of image acquisition is critical as in crop identification. This may be avoided by using either microwave or airborne remote sensing. However, processing of these data can be a problem due to the scientific expertise needed for analysis of microwave data and the data management associated with large area airborne acquisitions.
The period over which remotely sensed data are available has little impact on agricultural applications. Most agricultural research and management is interested in current or future concerns. However, for the few agricultural projects dealing with historical context, the recording period could be restricting. Remote sensing, unlike meteorological data, has not been recorded for a century. The longest time series currently available of free to ground remotely sensed data covering Australia at monthly time steps is AVHRR at 15 years. LANDSAT data has been recorded since 1972, but can be quite expensive when acquiring a long time series
The limited capability of remote sensing to map certain agricultural variables has been discussed in detail in section 3. Specifically, remote sensing is limited to mapping single crops to slightly higher than 90% accuracy when multi-date, multi-sensor, or GIS data is also used. Remote sensing alone, however, is more limited at discrimination of multiple crops to this level of accuracy. Yield predictions are also limited from remotely sensed data because of the saturation problem discussed in section 3.3. Remote sensing is also often unable to detect direct sources of crop damage (section 3.4). These limitations may decrease in the future as spatial and spectral resolutions, and repeat cycles increase. However, the resolutions needed for this type of detection will probably not be available for some time. Finally, although remote sensing from satellites has high potential for providing spatially variable data needed for precision agriculture, the limitations of fixed spectral bands, too coarse spatial resolutions, inadequate repeat cycles, and long delivery times (Moran et al., 1997) make it non operational at this time.
Agricultural research with remote sensing requires a moderate level of expertise and computing support. The processing of remotely sensed data requires an investment in training of personnel as well as adequate computers and data storage. Computer hardware and software are important, but perhaps more important is mindware to ensure the correct use of remote sensing to assist in the decision making process.
Cost of remote sensing projects can be prohibitive, especially when fine detail is needed over large areas. However, this depends on the application and the appropriate remote sensing platform. Much agricultural research has been accomplished with free NOAA AVHRR data. Yet, AVHRR data is not appropriate for many applications. With the launch of the TERRA satellite in 1999, came a new era in remote sensing: no cost moderate to fine resolution data. The spatial resolution of the ASTER and MODIS sensors is appropriate for many different agricultural applications. However, some remote sensing data is currently expensive for large areas of land (e.g., 1,000 km2), including very high spatial resolution data (e.g., IKONOS or airborne systems), and hyperspectral data.
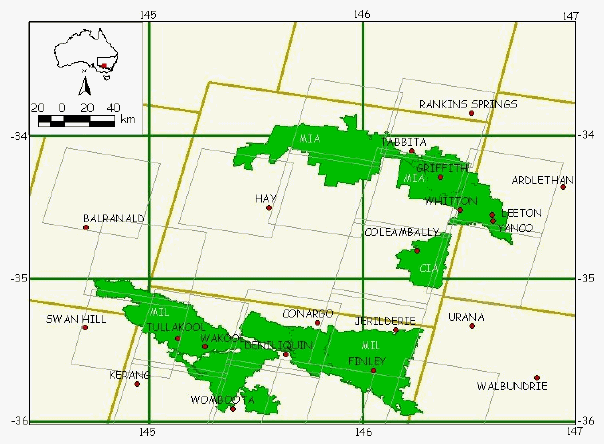
The cost estimates for specified common commercially available remotely sensed data is summarised in Table 3 by each irrigation area in southern NSW. These estimates are intended to give potential users of remotely sensed data a general idea of the costs involved, and by no means are meant as a precise cost. Values in this table are most useful when viewed in the relative context of prices by sensor and by irrigation area. Figure 5 provides the spatial context of the extent of two popular sensors ((E)TM and SPOT) for the study site.
Table 3: Cost estimates for specified remotely sensed data
Irrigation Area |
TM |
ETM |
SPOT PAN |
SPOT X |
IKONOS1 |
$750 |
$600 |
$1,530 |
$1,430 |
$11,172 | |
MIA3 |
$2,375 |
$2,200 |
$7,600 |
$6,800 |
$63,468 |
MIL4 |
$3,025 |
$2,400 |
$9,500 |
$8,500 |
$97,176 |
1 IKONOS column represents the price for either 1m panchromatic or 4m multispectral data.
2 CIA estimates for TM and ETM, were based on one prices for one ninth scene (up to 3,600 sq km) (map oriented price). SPOT PAN and SPOT X costs are based on one half scene (up to 1,800 sq km) (map oriented price), and IKONOS costs are based on price per area (931 sq km * $12 AUS/sq km = $11,172).
3 MIA cost estimates for TM and ETM are based on one full scene and one ninth scene (full scene is path image price and ninth scene is map oriented price). SPOT PAN and SPOT X costs are based on 4 full scenes (path image price), and IKONOS estimates are based on price per area (5,289 sq km * $12 AUS/sq km = $63,468).
4 MIL estimates for TM and ETM are based on one full scene, one ninth scene and one small scene (path image price for full and map oriented price for ninth and small). SPOT costs are based on 5 full scenes (path image price), and IKONOS costs are based on price per area (8,098 sq km * $12 AUS/sq km = $97,176).
|
Figure 5. SPOT and (E)TM satellite `footprints' for the study site. TM footprints are the large rectangles represented with heavy lines. Selected SPOT footprints are the smaller rectangles represented with light lines. The ETM image on the front cover is for the top centre ETM `footprint'.