This international research project continues a program of research that has been developed by the researchers in Canada and Australia. Lyn Hay and James Henri have completed a qualitative study in Australia, based on work done in this area by Dianne Oberg and Linda LaRocque in Canada (LaRocque & Oberg, 1991; Oberg, 1996). Findings from the Canadian study were presented at the 1990 IASL conference (LaRocque & Oberg, 1990) and findings from the Australian study were presented at the 1995 the IFLA Schools Section Standing Committee meeting and in Australia as well (Hay & Henri, 1995; Henri & Hay, 1996). The qualitative studies, conducted by Oberg and LaRocque and by Hay and Henri provided analyses of the ways that principals working within an information literate school community are able to support the teacher librarian. The projects also identified the methods used by teacher librarians to involve the principal in the development of effective school library and information services. The Canadian project involved 5 schools in Alberta; the Australian project was undertaken in 6 schools in New South Wales.
Having identified the factors of
influence and support that exist between the principal and the teacher
librarian, the researchers have undertaken the development of a quantitative
study to test the existence of these factors across a broader range of
schools. In doing so, statistical measures have been employed to test the
correlation of years of service, types of experience, and qualifications
of principals and teacher librarians; size of, and methods of communication
within the schools to the existence of various forms of support. While
the qualitative studies have provided in-depth understanding of a small
sample of schools, it is important to test the validity of these findings
over extended populations.
The International Study
The international study involves
a quantitative investigation, surveying both principals and teacher-librarians
about principal support, making use of data from the original qualitative
studies. Involvement of other countries in the study began at the 1995
IFLA conference, and funding was sought from both IFLA and IASL. For last
years IFLA conference, the researchers organised a full day workshop.
Four papers were given on the research related to the role of the principal
(Dogg Hafsteinsdottir, 1997; Henri & Hay, 1997; Moore, 1997; Oberg,
1997), and a workshop was held for members of the International Research
Reference Group (IRRG) representing the seven countries involved in this
international study:
|
Australia
|
James
Henri
Lyn Hay |
Senior
Lecturer
Lecturer, School of Information Studies, Charles Sturt University |
|
Canada
|
Dianne Oberg | Associate Professor, University of Alberta |
|
Finland
|
Liisa Niinikangas | Information specialist and Partner, Lighthouse Consulting |
|
France
|
Colette Charrier | School
Librarian, Lycee Guez de Balzac,
Member of FADBEN |
|
Japan
|
Setsuko Koga | Professor, Aoyama Gakuin University |
|
Scotland
|
James Herring | Head of School (Acting), Department of Communication and Information Studies, Queen Margaret College |
|
South Korea
|
Yoon Ok Han | Kyonggi do University, Suwon-City |
Research Methodology
Questionnaires, based on the interviewee data fields used and the key factors resulting from the original qualitative studies, were developed and tested in Australia. Two model questionnaire sets -- one for principals and one for teacher librarians -- were developed. The questionnaires include both forced choice and open-ended questions.
The piloting of these instruments was conducted in Australia using standard hard copy questionnaires employing a four point Likert scale, with a zero weighting for the additional category "cannot comment." The traditional five point scale was rejected because the instruments were lengthy and it was felt that there might be an interest in over-using a mid point. The Internet was used to distribute the pilot instruments, however, the inability of many respondents to translate email attachments resulted in the faxing and/or snail mailing of instruments to the majority of respondents.
In-school research is typically slow because of the approval protocols, and because the candidate respondents are usually very busy professionals. It was with these factors in mind that the decision was made to transfer the administration of the process from a snail mail, paper-based approach, to an online Web based approach.
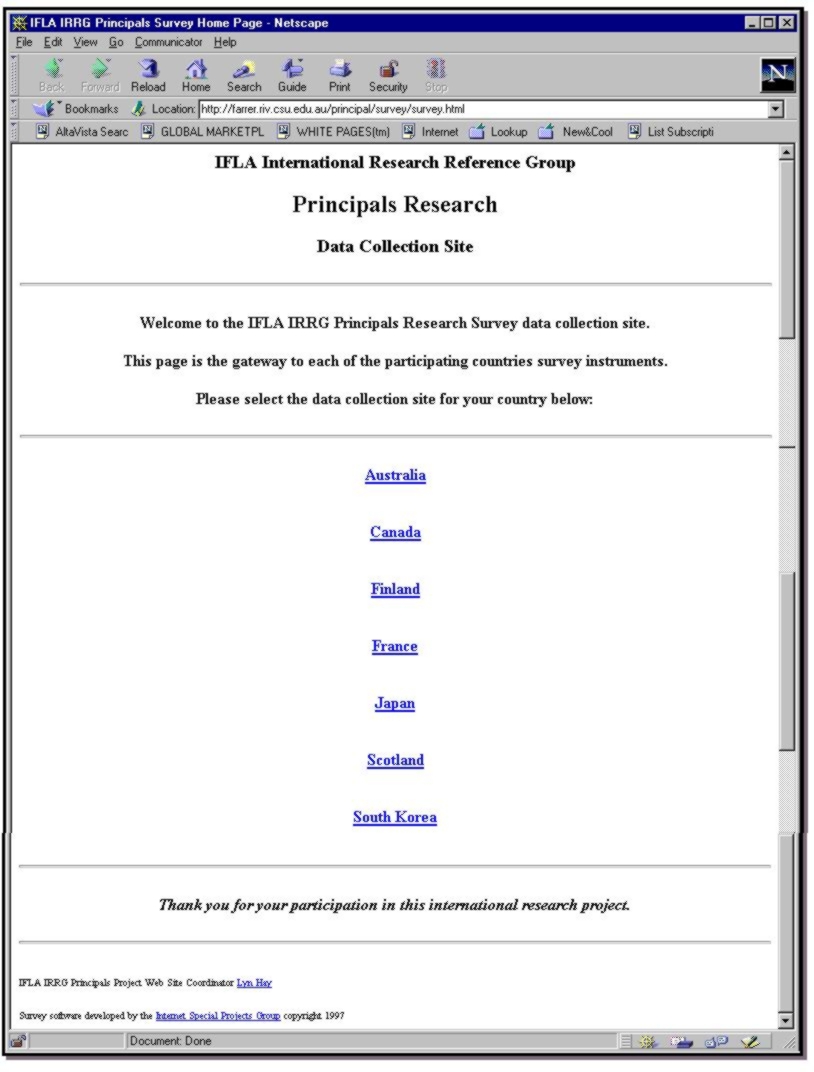
Lyn Hay was the IRRG Website Coordinator and consulted with IRRG members to adapt and translate the questionnaires to be mounted as interactive HTML forms on the IRRG Principals Project website.
Figure 1 illustrates the homepage of the IRRG Data Collection site at http://farrer.riv.csu.edu.au/principal/survey/survey.html:
Each IRRG member was responsible
for the collection of data in their country and for the entry of those
data via the WWW database at the School of Information Studies, Charles
Sturt University (CSU). Where possible, the study participants were asked
to enter their responses on an electronic format of the questionnaire,
ie. accessed via the WWW. The quantitative data was analysed using SPSS
by Hay and Henri at CSU*. Statistical measures were employed to test the
correlation of years of service, types of experience, and qualifications
of principals and teacher librarians; size of, financial status of, and
methods of communication within the schools, and so on to the existence
of various forms of support. The qualitative data from the open ended questions
was analysed using a framework and procedures developed by Oberg at the
University of Alberta. Each member of the IRRG was responsible for compiling
a report, based on findings from both qualitative and qualitative data
analysis, for their own country. The presentation of these reports comprise
the agenda for the morning workshop held at IFLA98 in Amsterdam, The Netherlands
-- Session 158B for the IFLA Section of School Libraries and Resource Centres
on The Role of the Principal in an Information Literate School Community:
an International Research Panel.
The Online Approach to Data Collection
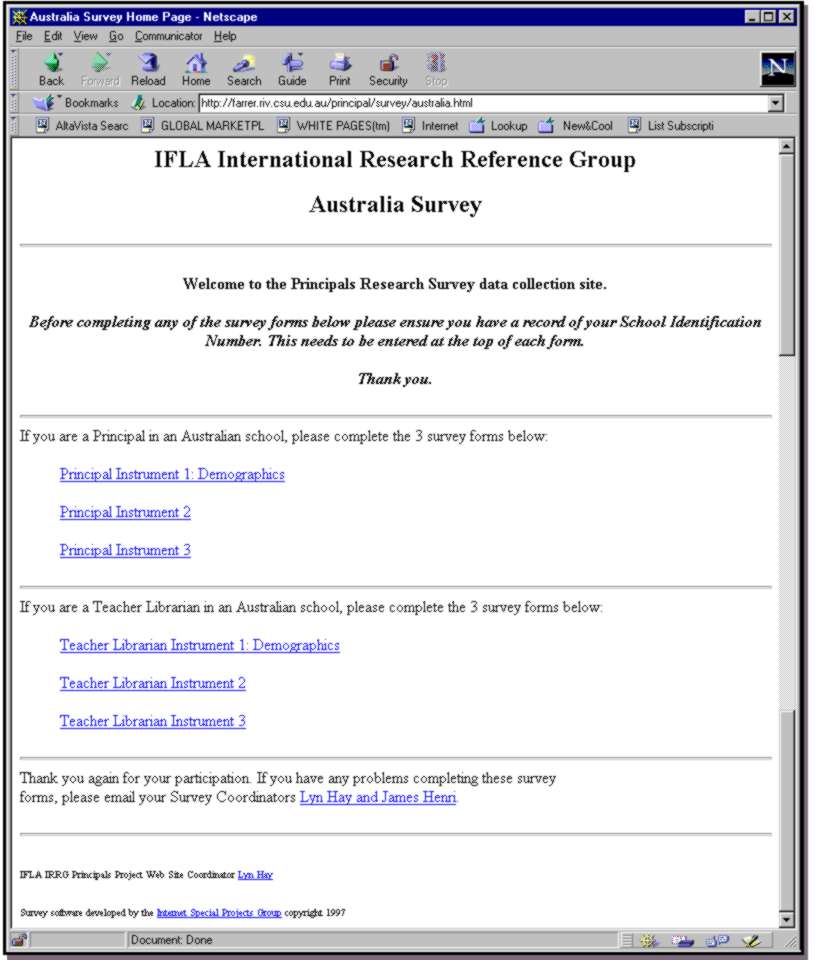
Each country was given its own homepage on the data collection site. This was designed to provide a direct gateway for subjects wishing to submit their answers to questions online. Figure 2 (below) illustrates the Australian homepage on the IRRG Data Collection site at http://farrer.riv.csu.edu.au/principal/survey/australia.html (this format became a template for all other country homepages).
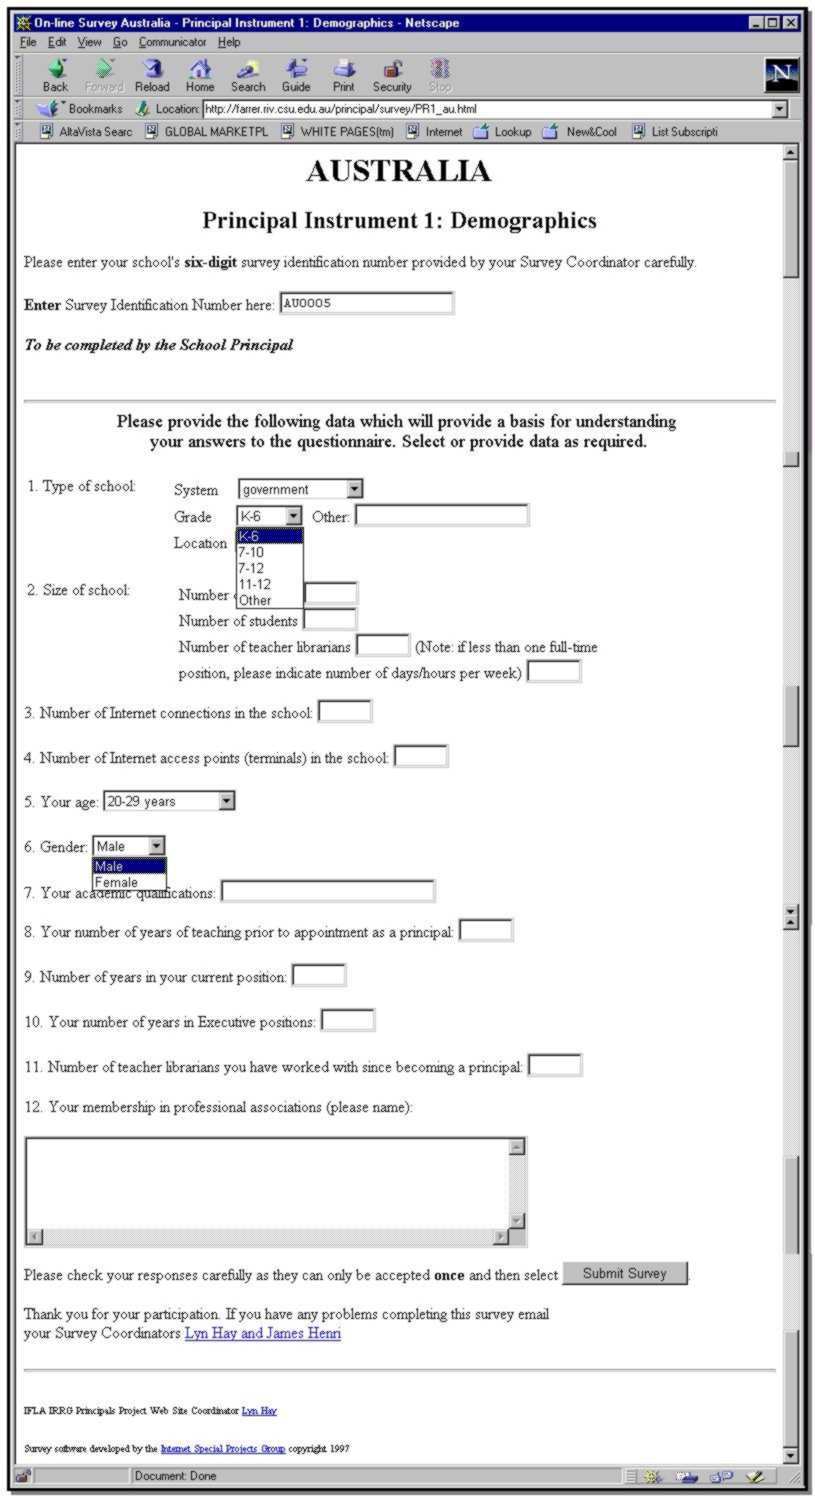
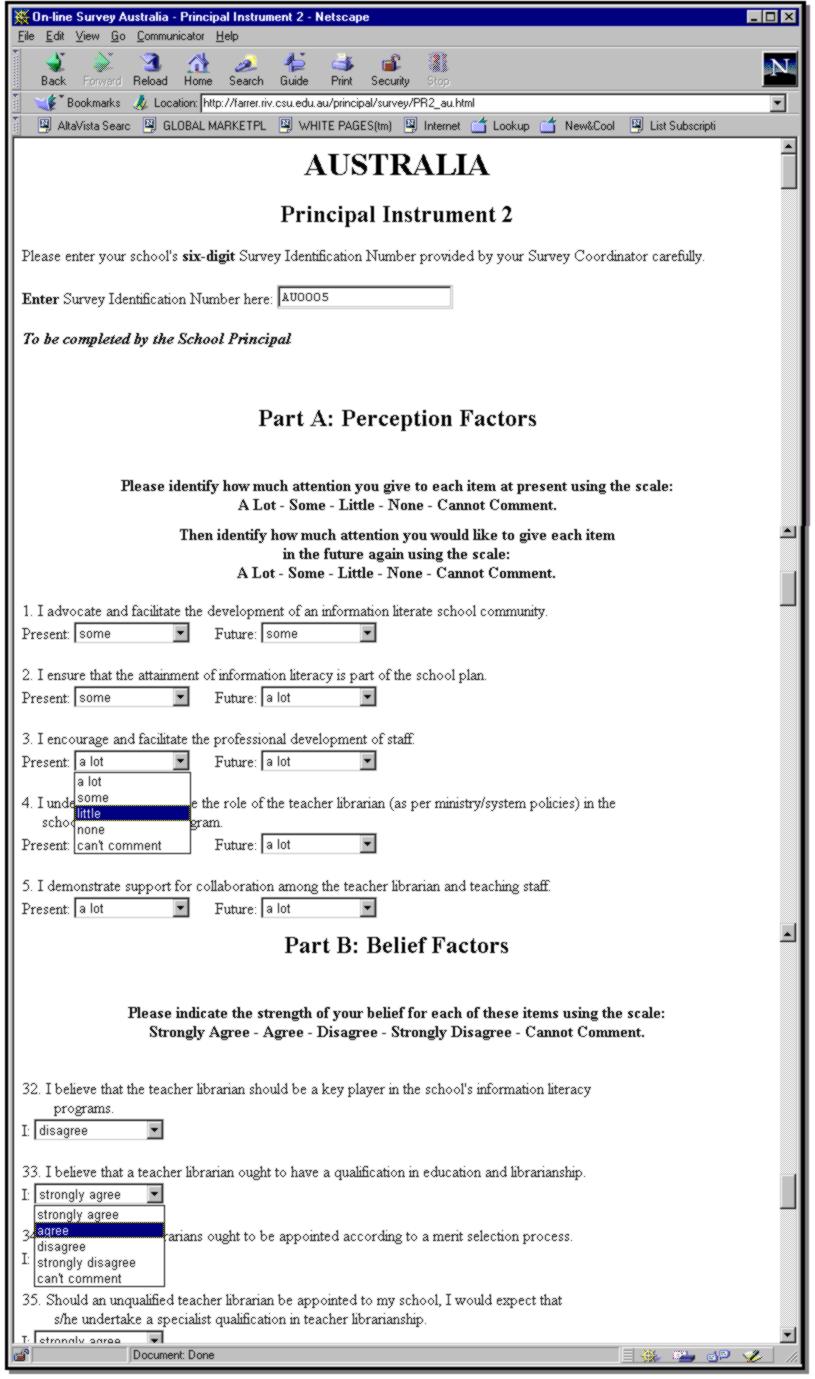
Figures 3, 4 (see Appendix) and 5
(below) are examples of the templates used for the creation of each of
the online instruments for each country.
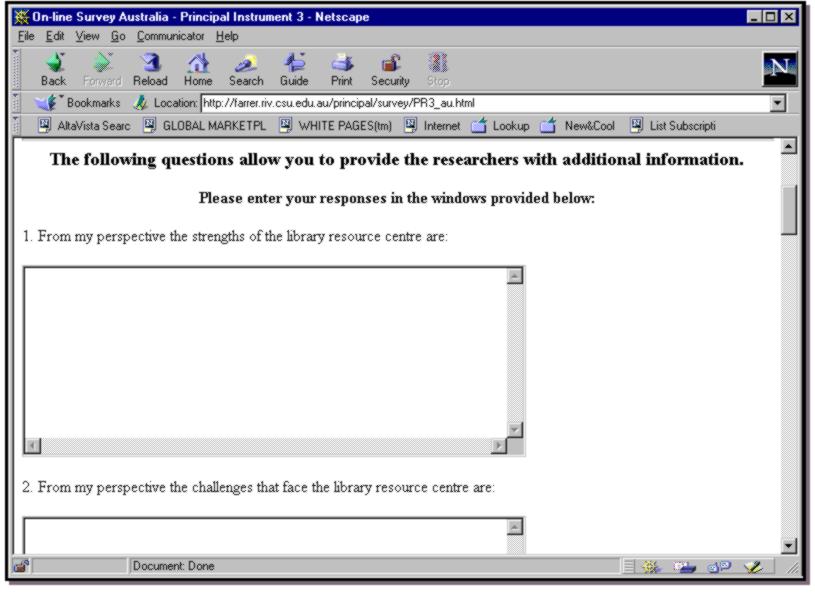
Each school was assigned a School Identification Number (SIN) which was an essential requirement for online data entry. The principal and teacher librarian of a school were given the same number, ensuring the data sets from each could be electronically matched and manipulated in preparation for the data analysis phase. Three instruments were used to collect data. Instrument 1 collected demographic data from each of the principals and teacher librarians, and included a combination of pull-down menu selection of set fields, and short and open-ended question fields. Instrument 2 collected data on the activities and beliefs of the principal and teacher librarian using Likert scales, each value could be selected from a series of pull-down menus. Instrument 3 collected responses to 12 open-ended questions which were entered using a series of open window fields.
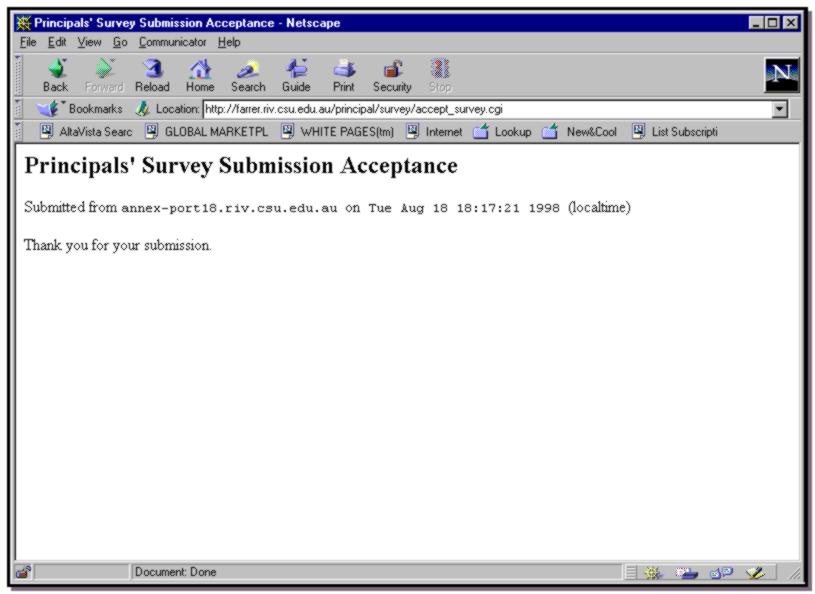
All raw data was tagged by the Schools Individual Number (SIN) and the instrument number. Figure 6 illustrates the accept data webpage generated to confirm a respondents successful submission of an online instrument:
The online questionnaires employed a simple Common Gateway Interface (CGI) script to capture data in a form that could be processed by Standard Generalized Markup Language (SGML ISO 8879:1986 see: http://www.oasis-open.org/cover/sgml-xml.html)tools. The CGI scripts were written in Python http://www.python.org, a programming language that is much easier to write than the scripting language popularly used for scripting, Perl http://www.perl.org. Python was also used to convert the questionnaire data into a suitable form for processing.
The main challenge in the designing the online data collection site was making sure the complex questionnaires had unique field names for each of the questions. In future, it would be preferable to write a script to generate the HTML questionnaires. A questionnaire could be marked up according to an Extensible Markup Language (XML, http://www.oasis-open.org/cover/xml.html), DTD, and a script written to generate the final online document. XML is a simplified version of SGML designed for online applications. It is likely to replace HTML as it is much more versatile.
Whilst the administering of a traditional snail mail based questionnaire is fraught with danger, eg. postal strikes, non-delivery, incorrect delivery, and so on, so too is an online product. This case was no exception and there were a number of minor problems typically associated with the online operation. The server was subject to several power failures (as part of ongoing building construction at CSU) and outages (as networks systems were being improved). The unique School Identification Number (SIN) would have been more reliable had it included a check digit which would have guarded against a respondent entering an incorrect number. Although the snail mail version of the instruments were tested through the pilot process, the online version received only in-house testing. Previous experience with programming of online instruments had ensured that the system was robust enough to cope with the typical errors (though the original error message was somewhat facile "programmer error"). Error reports from some respondents indicated that more robust public testing would have been beneficial.
Problems with instrument design created one problem and one potential problem. One question in particular in the demographics, Principals Instrument 1, caused problems. Question 2 asked (among other things) for the number of teacher librarians employed in the school. A note asked that where there was "less than one full-time position, please indicate number of days/hours per week." The data entered by subjects was 'open', and the instrument designers had not foreseen the number of ways this data could be packaged. For example, a TL who teaches for 3 days could be entered as either: (a) 3 days; (b) 0.6 of a position, or (c) 18 hours per week. While the majority of data could be coded correctly, some data was ambiguous and could not be used as an accurate measure. This was the major flaw in survey instrument PR1. The potential problem was associated with the online version only and was related to the choice of default. When designing the online version the default had been set at "a lot" and "strongly agree" with the thought that this would force respondents to make a choice. What had been overlooked was that a respondent who ignored a question would (by default) be entering a value. Fortunately a careful inspection of the data showed that this did not happen. However, in future, the default will be set at "Please Select."
In addition to the problems associated with lack of testing noted above some additional problems should be mentioned. Many respondents did not have sufficient skills to independently enter all of the required data and submit their surveys successfully. The online approach is dependent upon the robust nature of individual schools Internet connections. If all data were not entered prior to a connection failure, schools lost what they had previously entered on the instrument on which they were currently working. Should this happen a number of times to the one respondent, it is unlikely that s/he would submit the data. If respondents did not enter a School Identification Number (SIN), their completed instrument could not be submitted. (While this represents a frustration, a submitted instrument without a SIN would prevent pair matching and would therefore be less valuable.)
A tabular summary of all data entered
was monitored via a "Principals' Survey Submission List" webpage at http://farrer.riv.csu.edu.au/principal/survey/list_surveys.cgi.
Figure 7 illustrates the effectiveness of the data collection script in
monitoring and managing the online data collection process regarding pair
matching.
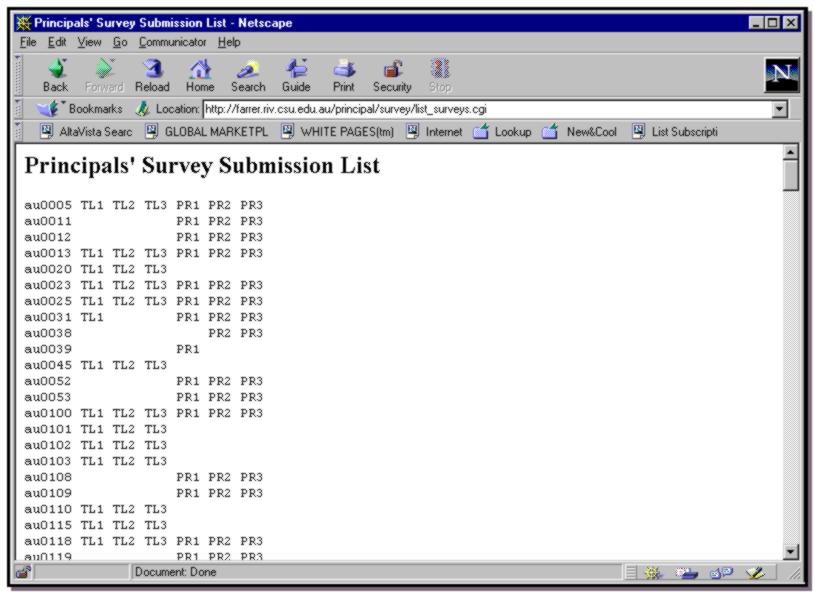
This allowed individual country coordinators and the project managers to monitor the percentage of data collected and allowed simple identification of missing instruments and SINs that have not submitted. A significant benefit of this is that it can facilitate the chasing of outstanding surveys from schools. The success of the project hinged, to some extent on the successful completion of instruments by the teacher librarian and principal of each responding school. The involvement of both allows for analysis on paired responses. If only one of the pair returned their data other analysis can be successfully undertaken, but the value of the study was diminished somewhat. A weakness in the project was been that unless the teacher librarian and principal communicated about the project neither would know whether the other had completed the instruments. It could be guessed that such communication is less likely to occur in schools that are at the lower end of the information literate school community scale.
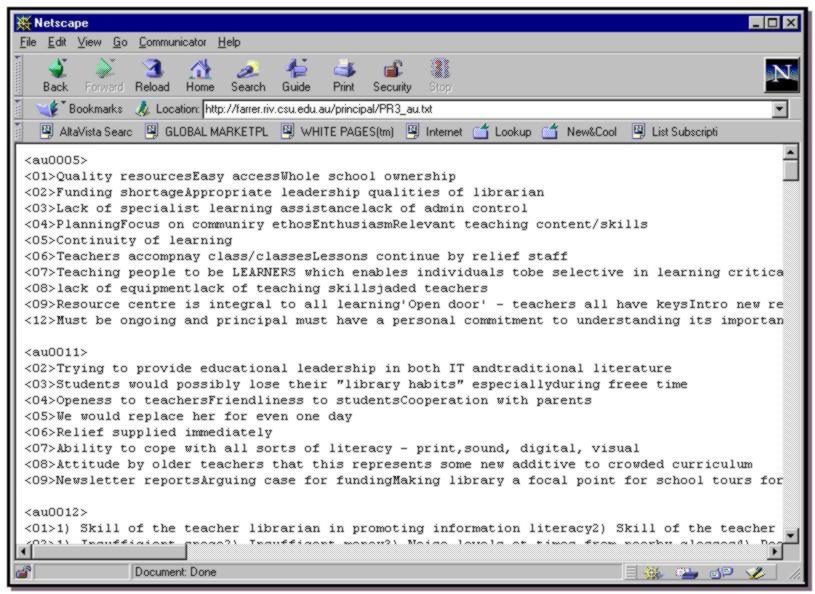
Hard returns made in the boxes provided for free choice responses also caused problems for data importation in preparation for data analysis. A hard return was read by the program as being a discrete, new piece of data when in actual fact it could have been one of a series of points entered as an answer for one question. On identification of this problem, a script was written to correct this problem, as illustrated in Figure 8:
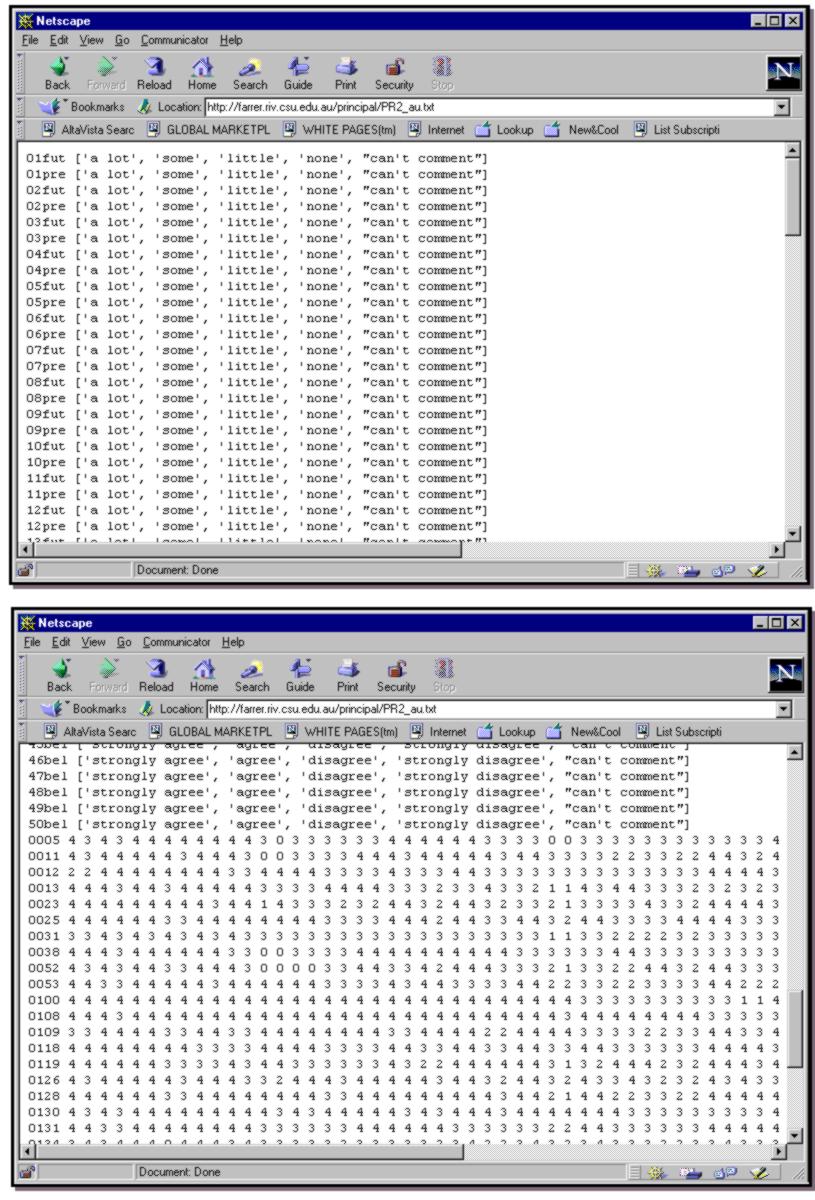
In addition data collection methods can be standardised across participating nations. Figure 9 (below) illustrates this standardised approach for quantitative data collection, which can be imported into the SPSS data analysis program. This is particularly useful because it facilitates standardised data testing and analysis across all countries and allows for simplicity in future comparative data analysis. These commonalities enhance the management of the project and enable ready monitoring of the progress and the timely identification of problems affecting all participating countries or arising from individual countries (if any).
The timeline for data collection time is reduced as respondents enter data directly to the server rather than onto paper and thereby requiring a third party to key in data. When funding is an issue this is of special benefit. In addition, all data entered via the Web are automatically formatted to be imported into a data analysis program.
Respondents were able to complete each of the three survey instruments separately which gave them the flexibility of time to enter as they wished, as against sitting at their PC for a substantial block of time. This may have enhanced the qualitative data entered in the third instrument. This approach was evident in a number of cases where subjects submitted half an instrument and then came back later and submitted the remaining data. Using the SIN and instrument tag, data collectors were able to successfully match the two pieces of data.
One of the goals of the researchers
was to review their overall research design and methodology in light of
their experience with this international project. The online approach provides
advantages to both the respondents and the researchers particularly in
a multi-country project where a number of languages were employed. The
significant reduction in data entry time and the collection of all data
together at a convenient point that enables a range of time savings and
enhancements that cannot be over valued. Like all cutting edge approaches,
however, it did create challenges for those respondents who were not regular
online users. Improvements in off-the-shelf software will enable enhancements
to the approach to be made. A system could be developed where a questionnaire
is typed into a word processor using special markers from which an online
questionnaire could be generated. The resulting entered data could be automatically
prepared for processing using SPSS. Microsoft Office '99, for example,
is expected to use XML for internal processing with 'styles' determining
the markup.
Data Analysis
Coding
The data analysis process for the
quantitative Instruments 1 and 2 was developed using the Australian data.
As each countrys data was analysed a comparative coding masterfile was
developed to accommodate the additions or changes made to instruments of
individual countries. A coding sheet was developed for coding of Instrument
1 for each country (see Figure 10 in Appendix).
Variables were created in SPSS for Windows 3.1 beginning with School Identification Number, TL_PR (Teacher Librarian (1) or principal (2)), and Country. Variables for perceptions, both future and present, in Instrument 2 were created for each question, ie. q1f, q1p, q2f, q2p, and belief questions, ie. q32b, q33b. The number 999 was entered for missing values section under each variable. Each of these variables were then labelled under the Label sections, so that coding is explained under each variable by double clicking on the variable label in the grid/ data file of the SPSS .sav file. All other settings remained as the default settings. All perception questions in Instrument 2, both present and future, were coded in the following manner:
Valid percentages were used in giving the frequency data. Thus all 999 responses were excluded from the calculations, eg. if there were 68 respondents and of those 10 were missing (999 codes), the percentages were calculated from the 58 respondents who had valid responses for that variable. Percentages were then recorded for the report in order of Teacher Librarian variables, Principal variables and then School variables. Percentages of each response for each variable were recorded, eg. with gender it might be that 59% of teacher librarians were female and 41% were male.
Descriptive
Data
Descriptive data (mean and standard
deviation) were used to provide a quick summary of the present, future
and beliefs data (ordinal data, 2 is more than 1 in value etc.). Due to
the coding and the later use of present, future and belief data in analyses,
it was more appropriate to use mean (average response) rather than how
many (percentage) for each code, eg. how many answered 1 - none to question
1 future, 2 - a little to question 1 future etc. The data was still split
at this stage so that teacher librarian and principal data was analysed
separately. Mean and standard deviation responses were tabulated for each
present and future question in one table. TL data was presented first.
TL average responses to each question was then presented in written form
for present and future. Mean and standard deviation responses for principals
was then tabulated in the same format as that for the teacher librarians.
Instead of a complete rundown for principals, a short paragraph summary
was given in respect of the teacher librarians responses, either before
or after the presentation of the principal table.
Belief responses were tabulated and presented for the TL followed by a summary of the beliefs that the teacher librarians as a group believed were accurate and then those which the Tls believed were not so accurate. Any mean over 3.0 was seen as being in clear agreeance with the belief. Any mean below 2.5 was seen as being in clear disagreeance with the belief. Belief responses were tabulated and presented for the principal followed by a summary of those responses which differed from those given by the TL, ie. if the teacher librarians had been in agreeance with a belief and the principals in clear disagreeance, then this response was presented.
T-tests
T-tests were carried out to compare
present versus future perceptions. A general standard of p<.001 was
set for significance due to the fact that so many t-tests were carried
out, thus increasing the chance of making an error (saying a result is
a significant difference when it in fact occurs by chance). Setting the
significance level so much lower helped prevent this error from being made.
Dependent t-tests were run for the present versus future questions. A dependent
t-test was used to compare teacher librarians responses to two different
questions, rather than two different peoples responses to the same question.
Results were tabulated giving the Mean, Standard Deviation for present
and then future and the P value for each question that was significantly
different from present time to future time spent. A written summary was
then given of the questions that were significant, eg. "Teacher librarians
believe their principals should be spending more time seeking feedback
from staff about their impressions of the quality of the LRC services than
they currently do". The same process was carried out for the principals.
Independent
T-tests
Independent t-tests were carried
out to compare the two different independent variables of TL and P on each
question, ie. q1f. Independent t-tests were carried out on all present,
future, and belief questions and significant results were presented. Again
significant results were generally set a p</= .001, but for some countries
it was p<.01. Results were then tabulated and a written summary given
of the results in terms of the present questions that the principal and
teacher librarian differed on, the future questions the principal and teacher
librarian differed on and then the beliefs the principal and teacher librarian
differed on. Tabulated results included the Levenes F value, Levenes P
value, T-value, degrees of freedom, p value, TL mean and standard deviation,
and Principal mean and standard deviation. Independent t-tests were also
carried out on the following variables: number of years in current position,
age, gender, number of years in executive positions, number of years teaching
prior to current appointment, qualifications, and professional associations
(number a member of). Significant results of these comparisons between
the principals and teacher librarians were tabulated as per the present,
future, belief questions, and a summary was provided.
Global Comparisons
A variable called Present was
created by adding up the respondents answers to each of the 31 present
questions, the results of which was recorded under the variable, so the
result would be out of 124 (31*4). A variable called Future was created
by adding up the respondents answers to each of the 31 future questions,
the results of which was recorded under the variable, so the results would
be out of 124 (31*4). A variable called Beliefs was created by adding
up the respondents answers to each of the belief questions, the results
of which was recorded under the variable. Independent t-tests were carried
out for these three variables comparing the principal and TL for each one
to see if they significantly differed from each other. All results were
tabulated and a written summary provided.
Qualitative
Analysis
Because the data from Instrument 1 gave information about the school context of the participants and about their education and experience, a composite picture was also developed by selecting the modal (most frequently selected) response for each of the categories in Instrument 1. From this analysis the researchers could create a composite picture of participants. The following are examples from the Canadian study:
The teacher-librarian is a female in her forties, with one year of training beyond her BEd. She has been a teacher-librarian for less than five years, and was appointed to the role after several years as a classroom teacher. She has served in other informal school and district leadership roles and she is a member of the specialist council for teacher-librarians. She is a regular reader of Teacher-Librarian Today (the publication of her specialist council) and Emergency Librarian (a commercial publication for Canadian and American teacher-librarians). Although the school is connected to the Internet, she does belong to a listserv.
Both principal and teacher-librarian were selected for their positions by a competitive application process. Compared to the teacher-librarian, the principal is senior in age, in teaching experience, and in experience beyond the classroom.
Conclusion
By the end of July 1998 the statistical analysis phase was completed. Further analysis of the qualitative data is required for all country data sets to explore the forms of support for teacher librarians offered by principals; the types of actions taken by teacher librarians to develop principal support; the strategies implemented by principals and teacher librarians in developing information literate school communities; and the professional development needs of principals and teacher librarians with respect to developing an information literate school community. A fourth and final phase of this study will be conducted during the latter half of 1998 in the form of a comparative analysis between findings of the seven nations.
This project has demonstrated the
potential benefits as well as the potential problems in conducting collaborative
research in teacher librarianship on an international scale. It is anticipated
that the project will contribute to the development and publication of
an international set of guidelines for principals and teacher librarians
in developing effective information services and supporting information
literacy programs in schools.
* The authors acknowledge with thanks
the contributions of Geoff Fellows
of the Internet Special Project Group (ISPG) at Charles Sturt University
for his programming knowledge and general technical know how, and Natasha
Wood, Charles Sturt University Psychology Honours graduate for her data
analysis and reporting of Instruments 1 and 2.
References
Dogg Hafsteinsdottir, H. (1997). The attitude of Icelandic principals towards school libraries: A survey. Paper presented at the IFLA Conference, Section of School Libraries and Resource Centres, Copenhagen, Denmark.
Hay, L., & Henri, J. (1995). Leadership for collaboration: Making vision work. Paper presented at the IFLA Conference, School Libraries Programme Session, Istanbul, Turkey. Available: http://www.ifla.org/IV/ifla61/61-hayl.htm, April 30, 1998.
Hay, L., Henri, J. & Oberg, D. (1998). The principal's role in developing information literacy: Findings from Australia and Canada. Paper presented at the IASL98 Conference, Israel.
Henri, J. & Hay, L. (1996), The principal's role in developing and supporting an information literate school community. In Beyond the Horizon: Conference Proceedings of the Fourteenth Biennial Conference of the Australian School Library Association (pp. 111-125). West Perth, Australia: ASLA.
Henri, J., & Hay, L. (1997). Understanding principal patronage: Developing and piloting a quantitative instrument. Paper presented at the IFLA Conference, Section of School Libraries and Resource Centres, Copenhagen, Denmark.
LaRocque, L., & Oberg, D. (1990). Building bridges between the library and the principal's office. Proceedings of the 19th Annual Conference of the International Association of School Librarianship, Umea, Sweden.
LaRocque, L., & Oberg, D. (1991) The principal's role in a successful library program. The Canadian School Executive, 11(4), 17-21.
Moore, P. (1997). Teaching information problem solving in primary schools: An information literacy survey. Paper presented at the IFLA Conference, Section of School Libraries and Resource Centres, Copenhagen, Denmark.
Oberg, D. (1996). Principal support: What does it mean to teacher-librarians? In L. A. Clyde (Ed.), Sustaining the vision: A collection of articles and papers on research in school librarianship in honor of Jean E. Lowrie (pp. 222-230). Castle Rock, CO: Hi Willow Research. Available: http://www.ualberta.ca/~doberg/prcsup.htm, April 30, 1998.
Oberg, D. (1997). Principal support:
Research from Canada. Paper presented at the IFLA Conference, Section of
School Libraries and Resource Centres, Copenhagen, Denmark.
Variable Code and Meaning:
Government (type of school)
1 = Governmental
2 = Community
3 = Private
School (year level of school)
1 = 1-6
2 = 7-9
3 = 10-12
4 = K-6
5 = 7-12
6 = 7-10
7 = 11-12
8 = K-10
Rural (location of school)
1 = rural
2 = urban
Number of Teachers
1 = 0-19
2 = 20-39
3 = 40-59
4 = 60-79
5 = 80-99
6 = 100+
Number of Students
1 = 0-199
2 = 200-399
3 = 400-599
4 = 600-799
5 = 800-999
6 = 1000+
Number of Teacher Librarians
Specific number given by Principal
Number of Hrs TL if less than
Used numbers given and then one
full time TL grouped later after analysis
Number of Internet Connections
1 = 0-19
2 = 20-39
3 = 40-59
4 = 60-79
5 = 80-99
6 = 100+
Number of Internet Points
1 = 0-19
2 = 20-39
3 = 40-59
4 = 60-79
5 = 80-99
6 = 100+
Age
1 = 20-29
2 = 30-39
3 = 40-49
4 = 50-59
5 = 60+
Gender
1 = Female
2 = Male
Qualifications
1 = Certificate/Tafe/Trade/Music
2 = Bachelors Degree
3 = BA dip Ed/ Honours
4 = Masters
5 = PhD
Teach Prior (How many years
as teacher prior to appointment as Principal)
1 = 0-4
2 = 5-9
3 = 10-14
4 =15-19
5 = 20+
Number Current
1 = 0-4
2 = 5-9
3 = 10-14
4 = 15-19
5 = 20+
Number Executive
1 = 0-4
2 = 5-9
3 = 10-14
4 = 15-19
5 = 20-24
6 = 25+
Number of TLs Worked with
Specific number given by principal
Number Current
1 = 0-4
2 = 5-9
3 = 10-14
4 = 15-19
5 = 20+
Teach Prior
1 = 0-4
2 = 5-9
3 = 10-14
4 = 15-19
5 = 20+
IFLA IRRG Principals
Project Web Site Coordinator Lyn Hay
Updated 11
August 1999.
Copyright
1999